Evaluation of Continuous Particulate Matter (PM) Monitors for Coal-Fired Utility Boilers with Electrostatic Precipitators |
Ralph L. Roberson, RMB
Consulting & Research, Inc.
G. Clark Mitchell,
Southern Company Generation
Charles E. Dene, EPRI
ABSTRACT
This technical paper discusses the evaluation of continuous particulate matter (PM) monitoring technology for coal-fired utility boilers with electrostatic precipitators. A field evaluation of the continuous PM monitoring technology was conducted under the Electric Power Research Institute (EPRI) Compliance Assurance Monitoring (CAM) Protocol Development project. The EPRI CAM protocol development project has the primary objective of developing a "standard" CAM protocol for demonstrating compliance with particulate mass emission limits on ESP equipped units as required by the CAM regulation promulgated by the U.S. Environmental Protection Agency (EPA). The EPRI CAM project also included the evaluation of several ESP performance models to assess the viability of using computer-based models to document compliance with particulate emission limits. However, it is believed by some that if viable continuous PM monitoring technology exists, using such technology may be the more straightforward means of satisfying EPA’s CAM requirements.
The field evaluation program, which was conducted at Georgia Power Company's Plant Yates, was designed to provide data that can be used in a rigorous evaluation of both the ESP performance models and continuous PM monitors. The test plan was to evaluate three different ESP powering conditions, which would result in three different particulate mass emission levels, during 3 weeks of testing. The first two weeks of testing were back-to-back and the third week of testing was approximately 3 months later. The fundamental premise of this field evaluation was to use the initial week of testing to calibrate the PM monitoring technologies. The second week of testing, conducted immediately following the initial week, would provide information regarding the short-term accuracy and stability of the calibrations. The third week of testing, conducted approximately 3 months following the initial two weeks, would provide information regarding the long-term accuracy and stability of the calibrations.
This paper presents the results of the 3-week field evaluation program for the continuous PM monitoring technology. Results for the ESP modeling assessment are presented in another paper at this conference. While there are a number of PM monitors on the market, previous tests by EPA have produced performance results that are less than conclusive. According to the instrument suppliers, this past monitor performance has been compromised by (1) testing sources with very low particulate mass emissions (e.g., hazardous waste incinerators) and (2) poor precision of the Method 5 particulate tests conducted by EPA testing contractors.
TEST PROGRAM DESCRIPTION
The field test program, which was conducted at Georgia Power Company's Plant Yates, was designed to provide data that can be used in a rigorous evaluation of both the ESP performance models and continuous PM monitors. The test plan was to evaluate three different ESP powering conditions, which would result in three different particulate mass emission levels, during 3 weeks of testing, for a total of nine independent test conditions. The first two weeks of testing were done back-to-back and the third week of testing was approximately 3 months later. The fundamental premise of this field evaluation is to use the initial week of testing to calibrate the PM measurement technologies. The second week of testing, conducted immediately following the initial week provides information regarding the short-term accuracy and stability of the PM monitor and ESP model calibrations. The third week of testing, conducted approximately 3 months following the initial two weeks would provide information regarding the long-term accuracy and stability of the calibrations.
During the first week, three series of tests were performed. The initial test series was conducted with the ESP operating in an "as found" condition. The two other test conditions were obtained by simply deenergizing ESP fields. This simulates the complete loss of ESP sections, which is the most common failure mode of an ESP. During the second week of testing, the higher dust loading conditions were achieved by turning down power on all ESP sections in increments. This mode of ESP operation simulates problems attributable to high resistivity ash or close clearance. Five stack sampling runs were conducted at each of the three test conditions. Each stack sampling run consisted of performing two simultaneous particulate emission tests using EPA Method 17. Simultaneous Method 17 tests were performed for two reasons: (1) to evaluate the variability of the test method when tests are performed with two independent sampling trains and (2) to provide a mechanism for rejecting "invalid" test data. To support the ESP modeling work, the ESP inlet was also tested for particulate mass loading, particle size distribution and ash resistivity on first day (Monday) of each test week.
Description of Test Site
Yates Unit 7 has a conventional Combustion Engineering tangentially-fired boiler with steam conditions of 1000° /1000° F and a rated capacity of 360 MWe. The unit, which began commercial service in 1974, burns eastern bituminous coal and is dispatched as a load-following unit. Low NOx burners with separated overfire air were installed on Unit 7 during a 1994 outage. For purposes of this test program, the load was fixed at 350 MWe. Yates Unit 7 is subject to a particulate emission limit of 0.24 lb/106 Btu. The unit also has a 6-minute average opacity limit of 40 percent, and a 4-hour average opacity limit of 34 percent.
The Yates Unit 7 ESP consists of two side-by-side boxes, each with 10 electrical and mechanical fields in the direction of gas flow. The first two fields are 6-feet long, and the remaining fields are 3-feet long in the direction of gas flow, for a total ESP treatment length of 36 feet. The plates are 30 feet high. The nominal specific collection area (SCA) is 300 square feet of plate area per 1,000 cubic feet of flue gas. The ESP internal velocity is fairly low, ~ 4.5 ft/sec.
Outlet (stack) emission testing was conducted in the 16-foot diameter stack at an elevation of 305 feet above grade. Since the outlet (stack) sampling location easily satisfies EPA’s Method 1 criteria of 8 diameters downstream and 2 diameters upstream from flow disturbances, only 12 individual sampling points were required. Southern Research Institute, under subcontract to RMB, performed all particulate emission testing.
Discussion of Test Setup and Results
The first week of testing at Yates went well; however, a couple of test conditions were encountered that were initially thought to be "unrepresentative." The first test series, with the ESP operating in an "as found" condition resulted in a stack particulate emission rate ~ 0.002 lb/106 Btu and 3% opacity. This particulate emission rate was much lower than anticipated, based on previous compliance tests conducted on Yates Unit 7. The second test day produced a particulate emission rate of ~ 0.06 lb/106 Btu and 15% opacity. The third test day yielded ~ 0.23 lb/106 Btu and 25% opacity. The third condition represented a desired high dust loading condition, although a significant number of "chunky" carbon particles were observed on the Method 17 filters. While these results were not exactly what were anticipated, the results provide for a better understanding of how the ESP responds and, combined with a understanding of the carbon carryover (rapping reentrainment) problem, facilitated subsequent test settings. In essence, it was not possible to cover the range of emissions needed for the second week by only reducing power in the ESP as originally planned. It was necessary to combine power reduction with removal of sections to achieve the desired range of results.
Our initial concern with the first week’s tests was that two of the conditions appeared to be unrepresentative of a "typical" ESP. We experienced extremely low loading on the first day and significant rapping reentrainment the last day. After some thought, we are now convinced that the reentrainment condition is probably fairly representative, as will be discussed below.
Week 1 Testing
Previous compliance tests had shown a particulate emission rate of ~0.01 lb/106 Btu. Upon arrival at Plant Yates it was discovered that the ESP had two full sections and one-half section out on one box and one full section out on the other box. The opacity was 3-4%. Therefore, the first ESP outlet test was done expecting about 0.01 to 0.02 lb/106 Btu emission rate - not 0.002 lb/106 Btu. As may be imagined, a rate of 0.002 lb/106 Btu is much lower than most all of the ESPs in the U.S. Also, the very low grain loading can cause problems with the ESP models and may be problematic for the calibrations of some of the PM monitors. Fortunately, the accuracy of the ESP models and the PM monitors is not critical at such low particulate concentrations.
In order to achieve the second test condition of 0.06 lb/106 Btu, 60 percent of the ESP was deengerized. The remaining four fields were on automatic voltage control and the opacity was in the range of 12-15%. To obtain the third condition, only one more field on one box was deenergized. The opacity increased to 26 percent.
This last condition was expected to result in a mass loading of about 0.10 lb/106 Btu. Apparently, the point was reached where rapping reentrainment of relatively large unburned carbon particles (i.e., small but large relative to other flyash particles) became a major factor. These large carbon particles were probably in a size range where the opacity monitor is insensitive; therefore, the opacity/mass relationship breaks down. In other words, the particles contribute a significant amount of mass but little opacity. This is the classical reason why opacity monitors are often not good particulate monitors – the opacity/mass relationship is strongly dependent on particle size distribution.
While the last test condition has been previously suggested to be "unrepresentative", it is believed that many units probably have the same high carbon content ash particles because of low NOx burner conversions combined with short furnaces. It is also interesting to note that the ESP inlet particle size distribution was shifted toward a larger particle size than is usually considered normal for a pulverized coal boiler. A normal mass median diameter is usually about 16 microns and the result from Yates was around 21 microns during the first week of testing.
Week 2 Testing
The test procedure for the second week was the same as for the first week except that instead of taking complete ESP fields out of service, test conditions were established using a combination of overall power reduction and some fields out. In addition, the first test was not done at full ESP power because there did not appear to be any need to test again at the very low emission rate.
ESP inlet mass loading, ash particle size distribution and resistivity tests were performed on Monday, and the inlet results were very similar to those from the first week. ESP outlet tests were performed on Tuesday – Thursday.
Week 3 Testing
The test procedure for the third week was virtually a carbon copy of the second week. A combination of fields out of service and power reductions were used to obtain the desired particulate loadings. However, it should be emphasized that no effort was made to duplicate the conditions from the second week. After all, the objective of the project is to evaluate how well the continuous PM monitors predict particulate concentrations, regardless of the boiler/ESP conditions.
Again, ESP inlet tests were performed on Monday and the inlet mass loading was similar to that from weeks 1 and 2. We did, however note an upward shift in the mass median particle size from 21-24 microns during weeks 1 and 2 to approximately 31 microns during week 3.
RESULTS OF MANUAL STACK TESTING FOR WEEKS 1, 2 AND 3
The results of the particulate emission tests
conducted in the stack during all three weeks of testing are
summarized in Table 1.
| Table 1 – Stack Test Particulate Results | |||||||||||
| PM Emissions | PM Emissions | ||||||||||
| Date | Time | Test # | mg/m3 | Lb/106 Btu | Time | Test # | Mg/m3 | Lb/106 Btu | % Difference | ||
| 6/3/98 | 09:37 – 10:49 | 1 | 1.90 | 0.003 | 09:37 – 10:49 | 2 | 5.50 | 0.007 | 97.3% | ||
| 6/3/98 | 11:55 – 13:02 | 3 | 1.97 | 0.003 | 11:55 – 13:02 | 4 | 1.74 | 0.002 | 12.4% | ||
| 6/3/98 | 13:31 – 14:37 | 5 | 1.37 | 0.002 | 13:31 – 14:37 | 6 | 1.49 | 0.002 | 8.4% | ||
| 6/3/98 | 15:38 – 16:45 | 7 | 2.57 | 0.004 | 15:38 – 16:45 | 8 | 1.57 | 0.002 | 48.3% | ||
| 6/3/98 | 17:10 – 18:16 | 9 | 1.73 | 0.002 | 17:10 – 18:16 | 10 | 2.26 | 0.003 | 26.6% | ||
| 6/4/98 | 07:59 – 09:07 | 11 | 32.92 | 0.045 | 07:59 – 09:07 | 12 | 32.77 | 0.044 | 0.5% | ||
| 6/4/98 | 10:00 – 11:08 | 13 | 49.21 | 0.068 | 10:00 – 11:07 | 14 | 45.13 | 0.061 | 8.6% | ||
| 6/4/98 | 11:37 – 12:44 | 15 | 48.78 | 0.068 | 11:37 – 12:44 | 16 | 48.59 | 0.066 | 0.4% | ||
| 6/4/98 | 13:48 – 14:41 | 17 | 54.75 | 0.076 | 13:48 – 14:56 | 18 | 59.39 | 0.081 | 8.1% | ||
| 6/4/98 | 15:26 – 16:24 | 19 | 63.14 | 0.088 | 15:26 – 16:36 | 20 | 59.87 | 0.083 | 5.3% | ||
| 6/5/98 | 08:49 – 09:52 | 21 | 177.53 | 0.235 | 08:49 – 09:52 | 22 | 182.06 | 0.235 | 2.5% | ||
| 6/5/98 | 10:48 – 11:34 | 23 | 202.36 | 0.269 | 10:48 – 11:34 | 24 | 195.17 | 0.256 | 3.6% | ||
| 6/5/98 | 12:16 – 12:58 | 25 | 159.45 | 0.222 | 12:16 – 12:58 | 26 | 175.11 | 0.240 | 9.4% | ||
| 6/5/98 | 14:07 – 14:48 | 27 | 145.56 | 0.202 | 14:07 – 14:48 | 28 | 154.45 | 0.215 | 5.9% | ||
| 6/5/98 | 15:10 – 15:53 | 29 | 173.81 | 0.244 | 15:10 – 15:53 | 30 | 173.43 | 0.241 | 0.2% | ||
| 6/9/98 | 08:02 – 09:09 | 31 | 7.89 | 0.011 | 08:02 – 09:09 | 32 | 7.26 | 0.010 | 8.3% | ||
| 6/9/98 | 09:42 – 10:48 | 33 | 8.09 | 0.011 | 09:42 – 10:48 | 34 | 8.44 | 0.011 | 4.2% | ||
| 6/9/98 | 11:37 – 12:43 | 35 | 10.80 | 0.015 | 11:37 – 12:43 | 36 | 9.57 | 0.013 | 12.1% | ||
| 6/9/98 | 13:08 – 14:13 | 37 | 9.24 | 0.013 | 13:08 – 14:13 | 38 | 9.35 | 0.013 | 1.2% | ||
| 6/9/98 | 14:46 – 15:52 | 39 | 10.42 | 0.014 | 14:46 – 15:52 | 40 | 9.45 | 0.013 | 9.8% | ||
| 6/10/98 | 07:53 – 09:00 | 41 | 36.53 | 0.049 | 07:53 – 09:00 | 42 | 35.31 | 0.047 | 3.4% | ||
| 6/10/98 | 09:37 – 10:42 | 43 | 39.91 | 0.054 | 09:37 – 10:42 | 44 | 38.66 | 0.052 | 3.2% | ||
| 6/10/98 | 11:36 – 12:40 | 45 | 40.71 | 0.056 | 11:36 – 12:40 | 46 | 46.45 | 0.063 | 13.2% | ||
| 6/10/98 | 13:06 – 14:09 | 47 | 44.76 | 0.063 | 13:06 – 14:09 | 48 | 43.39 | 0.059 | 3.1% | ||
| 6/10/98 | 15:04 – 16:09 | 49 | 49.62 | 0.069 | 15:04 – 16:09 | 50 | 47.89 | 0.065 | 3.5% | ||
| 6/11/98 | 07:54 – 08:34 | 51 | 91.20 | 0.126 | 07:54 – 08:34 | 52 | 97.62 | 0.132 | 6.8% | ||
| 6/11/98 | 09:03 – 09:43 | 53 | 74.02 | 0.103 | 09:03 – 09:43 | 54 | 80.86 | 0.110 | 8.8% | ||
| 6/11/98 | 10:28 – 11:08 | 55 | 93.82 | 0.131 | 10:28 – 11:08 | 56 | 88.46 | 0.121 | 5.9% | ||
| 6/11/98 | 13:08 – 14:13 | 57 | 84.54 | 0.118 | 13:08 – 14:13 | 58 | 87.54 | 0.121 | 3.5% | ||
| 6/11/98 | 14:46 – 15:52 | 59 | 90.72 | 0.127 | 14:46 – 15:52 | 60 | 86.45 | 0.119 | 4.8% | ||
| 9/1/98 | 08:43 - 09:48 | 61 | 19.26 | 0.0245 | 08:43 - 09:48 | 62 | 16.16 | 0.0209 | 17.5% | ||
| 9/1/98 | 10:33 – 11:38 | 63 | 20.86 | 0.0268 | 10:33 - 11:38 | 64 | 19.07 | 0.0243 | 9.0% | ||
| 9/1/98 | 12:45 – 13:52 | 65 | 13.71 | 0.0176 | 12:45 - 13:52 | 66 | 15.71 | 0.0202 | 13.6% | ||
| 9/1/98 | 14:30 – 15:37 | 67 | 12.14 | 0.0157 | 14:30 - 15:37 | 68 | 11.97 | 0.0154 | 1.4% | ||
| 9/1/98 | 16:04 – 17:10 | 69 | 12.32 | 0.0160 | 16:04 - 17:10 | 70 | 11.36 | 0.0147 | 8.1% | ||
| 9/2/98 | 08:02 - 09:09 | 71 | 94.79 | 0.1217 | 08:02 - 09:08 | 72 | 94.44 | 0.1214 | 0.4% | ||
| 9/2/98 | 09:40 - 10:34 | 73 | 101.38 | 0.1315 | 09:40 - 10:34 | 74 | 95.16 | 0.1231 | 6.3% | ||
| 9/2/98 | 11:18 - 12:15 | 75 | 125.19 | 0.1614 | 11:18 - 12:15 | 76 | 117.13 | 0.1505 | 6.7% | ||
| 9/2/98 | 12:50 - 13:45 | 77 | 141.81 | 0.1832 | 12:50 - 13:45 | 78 | 128.59 | 0.1677 | 9.8% | ||
| 9/2/98 | 14:19 - 15:14 | 79 | 148.40 | 0.1934 | 14:19 - 15:14 | 80 | 140.93 | 0.1825 | 5.2% | ||
| 9/3/98 | 08:19 - 08:59 | 81 | 92.10 | 0.1170 | 08:19 - 08:59 | 82 | 88.07 | 0.1134 | 4.5% | ||
| 9/3/98 | 09:29 - 10:08 | 83 | 94.52 | 0.1210 | 09:29 - 10:08 | 84 | 91.33 | 0.1176 | 3.4% | ||
| 9/3/98 | 10:35 - 11:18 | 85 | 85.76 | 0.1120 | 10:35 - 11:18 | 86 | 83.70 | 0.1078 | 2.4% | ||
| 9/3/98 | 12:16 - 12:58 | 87 | 105.01 | 0.1352 | 12:16 - 12:58 | 88 | 95.42 | 0.1223 | 9.6% | ||
| 9/3/98 | 13:23 - 14:04 | 89 | 102.77 | 0.1335 | 13:23 - 14:04 | 90 | 106.46 | 0.1382 | 3.5% | ||
This table shows the comparison of the paired Method 17 runs for each of the five pairs on each day. For example, Test 1 and Test 2 are paired runs; they were conducted by two separate test teams sampling simultaneously, but starting in different test ports. This was done so that the total test variability, including location, process, test method and test team variability, would be included in the results.
The last column of Table 1 presents the percent difference (defined as the difference between a pair of runs divided by the mean of the runs) between each set of paired runs. With the exception of three sets of tests conducted on the very first day of testing (6/3/98), the precision of the paired runs was very good. We expected Run 2 to be biased "high" because of probe contact with one of the sampling ports. However, Run 1 was retained for statistical purposes; retention of Run 1 is justified by its numerical agreement with the other tests conducted on 6/3/98. The fourth and fifth set of tests (Runs 7, 8, 9, and 10) also exhibit a higher percent difference than is desired. However, we do not believe this is problematic because the computed percent difference is mostly dictated by the low mean concentration (i.e., » 2 mg/m3).
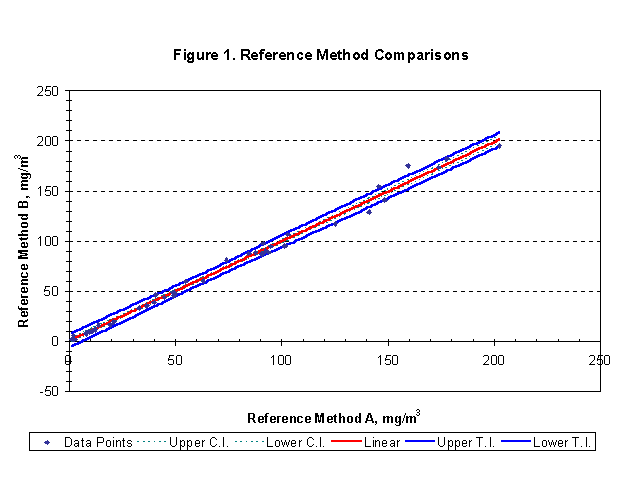
In keeping with our desire to evaluate the contribution of reference method variability to the variability of CAM protocols (whether PM monitors or ESP models), the Method 17 test results were subjected to the identical evaluation that were used for the PM monitors. (PM monitor results will be discussed later in this report.) This evaluation is to apply the proposed EPA PM Monitor Performance Specification (PS) 11 statistics. Figure 1 shows the odd number reference method tests plotted on the x-axis versus the even number tests on the y-axis. The PS 11 linear regression line, confidence intervals and tolerance intervals are also shown.

The confidence intervals are not very useful because all they tell us is that, if the entire experiment was repeated, there is a 95 percent probability that the new regression line would lie between the confidence intervals. The tolerance intervals are of the most interest because they predict that, if additional data points are taken in the original data set, there is a 95 percent probability that 75 percent of the new data points will fall between the tolerance intervals.
The width of the tolerance interval in Figure 1, in the y-direction, is approximately 12 mg/m3 and that width is driven by the maximum observed error (in mg/m3), or the error at the highest test point. This is good because the compliance point is exactly where we are interested in the accuracy of the reference test, PM monitors or ESP models. It should be noted that for CAM purposes owner/operators are only likely to be concerned with the upper tolerance interval or the potential overestimate. (However, EPA is most likely to be concerned with the potential underestimate.) In the case of the Method 17 tests, the width of the upper tolerance interval as well as the lower tolerance interval is about 6 mg/m3, which at a particulate concentration of 75 mg/m3 is 8 percent.
CONTINUOUS PARTICULATE MATTER MONITORS
Four continuous PM monitors were also evaluated as part of the EPRI CAM Protocol Project. Two of the instruments (one manufactured by the BHA Group, Inc. and one by PCME Ltd.) are in situ devices. These instruments work on the principle of optical scintillation, monitoring the variation in the amount of received light from a light beam transmitted across the stack or duct. The variation in the amount of received light results from the temporal distribution of PM, which attenuates light. Basically, these instrument determine the ratio of light variation to light intensity.
The other two instruments (one manufactured by Insitec and one assembled by Spectrum Systems) are extractive devices and use laser technology. Insitec uses the acronym "TESS," which stands for transform method for extinction scattering with spatial resolution, to explain its measurement principal. TESS is a patented technique based on laser light scattering; PM concentrations are based on the ratio of scattered to transmitted light. Spectrum Systems assembled its instrument using a laser-based technology manufactured by Sabata. Sabata is a Japanese company, which has been in the monitoring business over 20 years, and is reported to have a number of installations (both opacity monitors and PM monitors) throughout Japan. Of course, Plant Yates is required to monitor and to report excess opacity emissions. For opacity monitoring, the Yates Unit 7 stack is equipped with a Lear Seigler (LSI) RM41 opacity monitor. The LSI instrument was also included in the evaluation of potential continuous PM monitoring technology.
In analyzing the data from the continuous PM
monitors, a linear and a quadratic regression analysis was
performed for each instrument. These curves were developed using
the average of each pair of Method 17 stack test data for Week 1
as the y-value and the corresponding average instrument response
as the x-value. The results of the regression analysis are
summarized in Table 2. The equations shown in bold type in
Table 2 are the best-fit equations as determined from a
statistical test that assesses whether a linear or a quadratic
fit is superior at the 95 percent confidence level.
| Table 2 – Particulate Monitor Calibration Regression Analysis | |||||
| Instrument | Data | Linear | r2 | Quadratic | r2 |
| BHA | Week 1 | Y = 257X - 50.9 | 0.986 | Y = -81.4X2 + 350X - 70.4 | 0.988 |
| PCME | Week 1 | Y = 5.07X - 44.3 | 0.984 | Y = -0.0012X2 + 5.13X - 44.9 | 0.984 |
| Insitec | Week 1 | Y = 2.13X + 6.19 | 0.979 | Y = -0.0139X2 + 3.35X - 2.69 | 0.991 |
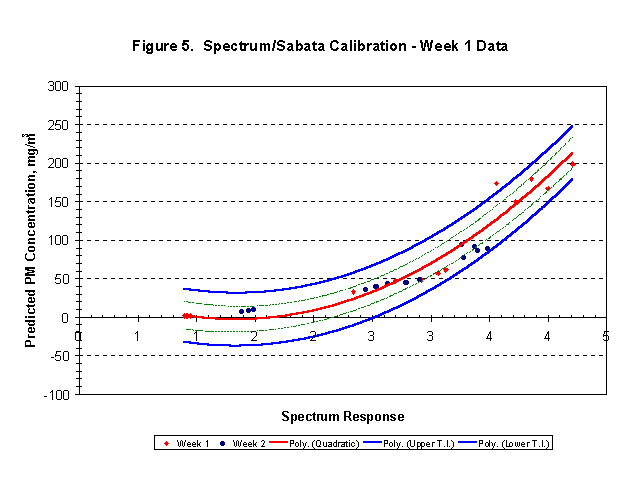
| Spectrum | Week 1 | Y = 53.7X - 61.3 | 0.825 | Y = 26.2X2 – 70.2X + 44.1 | 0.939 |
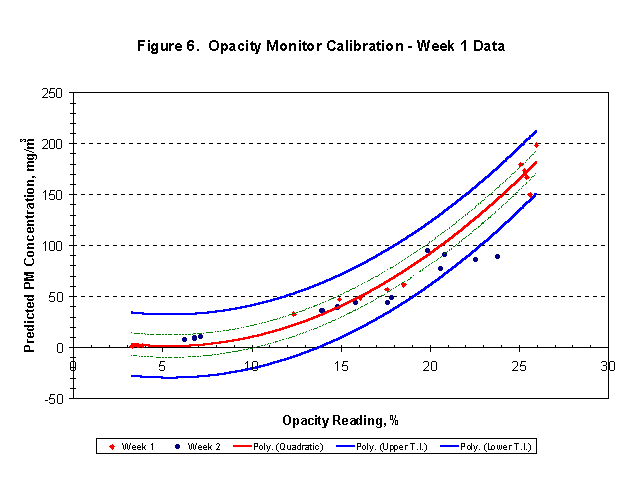
| Opacity (LSI) | Week 1 | Y = 7.59X - 38.5 | 0.882 | Y = 0.462X2 - 4.60X + 13.4 | 0.937 |
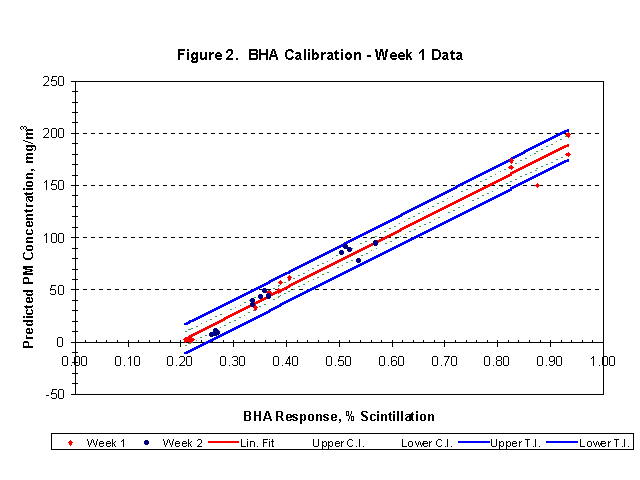
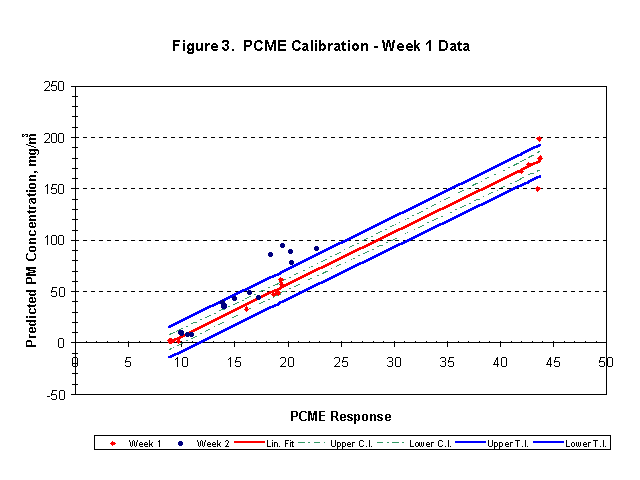
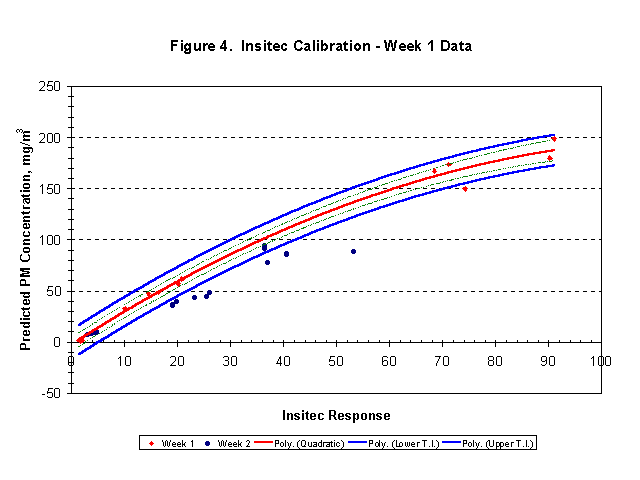
The results for the "best-fit" (i.e. linear or quadratic) regressions for the five instruments are presented graphically as Figures 2-6. Each of the five graphs also includes the data points from Week 2 tests to illustrate where they lie with respect to the Week 1 calibrations. It was encouraging to observe that the calibration for any individual monitor would not appear to change dramatically regardless of whether only the data from Week 1 (generally 15 observations) were used or whether the data from both weeks (generally 30 observations) were used.
To date, most of the regulatory initiatives for continuous PM monitoring have been led by EPA’s Office of Solid Waste (OSW). To support the PM monitoring requirements of the proposed hazardous waste combustor rule, EPA proposed Performance Specification 11 (PS 11) -- specifications and test procedures for particulate matter continuous monitoring systems. Proposed PS 11 is patterned after existing performance specifications for SO2 and NOx, but is decidedly more complicated. According to PS 11, a continuous PM monitor must be initially calibrated by conducting a total of at least 15 reference method tests at three or more different particulate mass concentrations (e.g., low, mid, and high). Then, a calibration curve is developed by performing a least squares regression on the continuous PM data and the reference method data. The most recently published version of PS 11 requires the following for an acceptable calibration curve.
Table 3 summarizes the performance of the
continuous PM monitoring instruments installed at Plant Yates
relative to the statistical criteria set forth in EPA proposed PS
11. The results presented in Table 3 are based on the calibration
curves developed from the Week 1 data.
| Table 3. Performance Relative to EPA’s Performance Specification 11 | ||||||
| Instrument | Correlation Coefficient | Confidence Interval | Tolerance Interval | |||
| BHA | 0.986 | Pass | 6.7% | Pass | 18.2% | Pass |
| PCME | 0.984 | Pass | 6.9% | Pass | 19.2% | Pass |
| Insitec | 0.991 | Pass | 9.4% | Pass | 19.2% | Pass |
| Spectrum | 0.939 | Pass | 21.1% | Fail | 45.5% | Fail |
| LSI (opacity) | 0.937 | Pass | 13.6% | Fail | 41.1% | Fail |
BHA
As Table 3 shows, the BHA instrument meets all of the PS 11 statistical criteria. Figure 2 presents the results obtained for the BHA instrument. Figure 2 shows the confidence intervals, the tolerance intervals, and the Week 2 data. This is the "best" calibration relationship of any of the instruments if "best" is defined by the width of the tolerance intervals in the Y-direction. For this case, the width is about 27 mg/m3 with a potential over/under estimate of about 13.5 mg/m3. As discussed above, if we assume that the reference method variability is contributing ±6 mg/m3, the performance of the BHA monitor during the first two weeks could only be described as quite good. It also should be noted that all of the data points from Week 2 lie within the tolerance intervals.
PCME
As Table 3 shows, the PCME instrument meets all of the PS 11 statistical criteria. Figure 3 presents the results obtained for the PCME instrument and also shows the confidence intervals, the tolerance intervals, and the Week 2 data. The linear fit is good but the width of the tolerance interval is a little wider than that of the BHA monitor, or about 29 mg/m3. It is somewhat perplexing as to why the third test condition (high dust loading) of Week 2 produced responses that are all outside (above) the upper tolerance interval. In fact, if the data from Weeks 1 and 2 were pooled, then a quadratic would be the best-fit calibration curve.
Insitec
As Table 3 shows, the Insitec instrument meets all of the PS 11 statistical criteria. Figure 4 presents the results obtained for the Insitec instrument and shows the confidence intervals, the tolerance intervals, and the Week 2 data. As Figure 4 indicates, a quadratic curve is a better fit than a straight line for the Insitec PM monitor. The quadratic fit is good with a tolerance interval width of about 29 mg/m3. However, the amount of Week 2 data that fall outside (below) the tolerance intervals is somewhat worrisome.
Spectrum/Sabata
As Table 3 shows, the Spectrum/Sabata system meets the confidence coefficient requirement of PS 11, but fails by a significant margin to meet the requirements for confidence interval and tolerance interval. Figure 5 presents the results obtained for the Sabata instrument and shows the confidence intervals, the tolerance intervals, and the Week 2 data. As Figure 5 indicates, a quadratic curve is a better fit than a straight line for the Sabata instrument. In order to be fair to Spectrum, it should be acknowledged that the Sabata System was put together very hurriedly to meet the schedule of EPRI’s CAM project, and Spectrum was afforded very little time to troubleshoot its installation.
LSI Opacity Monitor
As Table 3 shows, the LSI opacity monitor meets the confidence coefficient requirement of PS 11, but fails to meet the requirements for confidence interval and tolerance interval. Figure 6 presents the results obtained for the LSI opacity monitor and shows the confidence intervals, the tolerance intervals, and the Week 2 data. As Figure 6 indicates, a quadratic curve is a better fit than a straight line for the LSI opacity monitor. Perhaps the most interesting observation is the similarity of the Sabata’s calibration curve to that of the LSI opacity monitor’s calibration curve.
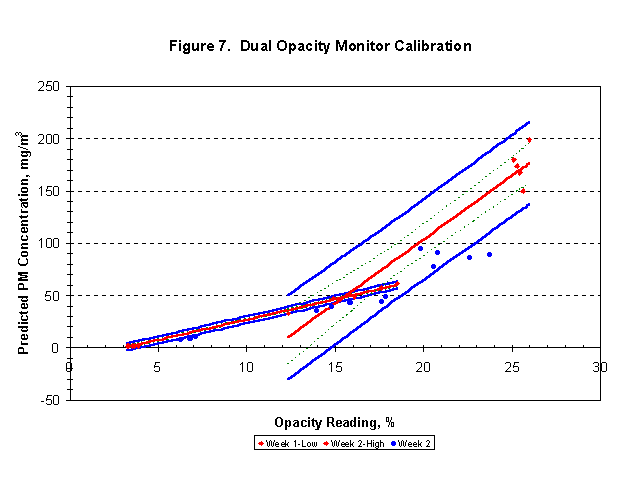
Also included is Figure 7, which shows a regression analysis that simply treats the response of the opacity monitor as two distinct regimes (i.e., low and high dust loading) and calculates a linear fit for each of them. Considering the "chunky" particles observed on the particulate filters and the evidence of rapping reentrainment as indicated by the opacity monitor recorder trace, Figure 7 may well be a realistic correlation for the LSI opacity monitor. It is interesting to observe that a pair of straight lines with different slopes is how one would approximate a quadratic curve, if one were only allowed to use straight lines. It is also interesting to observe the narrowness of the tolerance interval at low PM concentrations. This observation seems to sharply contrast those often repeated claims that opacity monitors lack sensitivity at low PM levels.
RESULTS FOR WEEK 3 – PM MONITORS
As discussed earlier, the third week of testing was done following a 3-month period of continuous operation. The objective of the third week of testing was to evaluate the long-term stability of the calibrations established for the ESP models and PM monitors during Week 1. The results of the particulate emission tests conducted in the stack during Week 3 have already been presented in Table 1.
As a means of evaluating the performance of the continuous PM monitors based on Week 3 data, one could apply the requirements set forth in EPA’s proposed Procedure 2 to Appendix F. The most important component of Procedure 2 appears to be the response calibration audit (RCA). Procedure 2 states that to perform a RCA you follow the same basic testing protocol as specified in PS 11 for the initial PM monitor calibration tests. However, Procedure 2 requires a minimum of 12 comparative test runs instead of the 15 required by PS 11. To pass the RCA, at least 75 percent of a minimum number of 12 sets of CEM/reference method measurements "must fall within a specified area on a graph developed by the calibration relation regression line over the calibration range and the tolerance interval set at ± 25 percent of the emission limit."
The result obtained from an RCA is a reasonable means of examining the performance of a continuous PM monitor. The third week of testing conducted at Plant Yates could be considered and analyzed as an RCA. As with PS 11, the RCA acceptance criterion is tied to an emission limit. For the purpose of conducting this analysis on the third week of the Plant Yates data, an assumed emission limit of 75 mg/m3 will continue to be used. As previously discussed, a limit of 75 mg/m3 is very close in numerical equivalency to 0.1 lb/106 Btu. There are on the order of 200 coal-fired boilers in the electric utility industry subject to EPA’s Subpart D new source performance standard (NSPS) particulate emission limit of 0.1 lb/106 Btu. Also, numerous States have a 0.1 lb/106 Btu emission limit for pre-NSPS coal-fired utility boilers.
RCA results for the BHA instrument are tabulated
in Table 4 and shown graphically in Figure 8. As one can see from
examination of the results, only seven of the 15 values (47%) lie
inside of the ± 25 percent tolerance
interval. Thus, the BHA instrument would not pass EPA’s
proposed RCA criterion.
| Table 4 - BHA Response Calibration Audit – Week 3 Testing | |||||
| Run No. | Predicted Value (mg/m3) | Measured
Value (mg/m3) |
Upper T.I.
(mg/m3) |
Lower T.I.
(mg/m3) |
± 25% T.I. |
| 1 | 39.06 | 17.71 | 57.81 | 20.31 | OUT |
| 2 | 38.55 | 19.97 | 57.30 | 19.80 | IN |
| 3 | 33.70 | 14.71 | 52.45 | 14.95 | OUT |
| 4 | 31.39 | 12.06 | 50.14 | 12.64 | OUT |
| 5 | 31.95 | 11.84 | 50.70 | 13.20 | OUT |
| 6 | 76.87 | 94.62 | 95.62 | 58.12 | IN |
| 7 | 77.69 | 98.27 | 96.44 | 58.94 | OUT |
| 8 | 90.88 | 121.16 | 109.63 | 72.13 | OUT |
| 9 | 89.63 | 135.00 | 108.38 | 70.88 | OUT |
| 10 | 98.71 | 144.67 | 117.46 | 79.96 | OUT |
| 11 | 104.74 | 88.91 | 123.49 | 85.99 | IN |
| 12 | 102.38 | 91.23 | 121.13 | 83.63 | IN |
| 13 | 92.89 | 87.905 | 111.64 | 74.14 | IN |
| 14 | 87.03 | 98.075 | 105.78 | 68.28 | IN |
| 15 | 97.89 | 104.615 | 116.64 | 79.14 | IN |

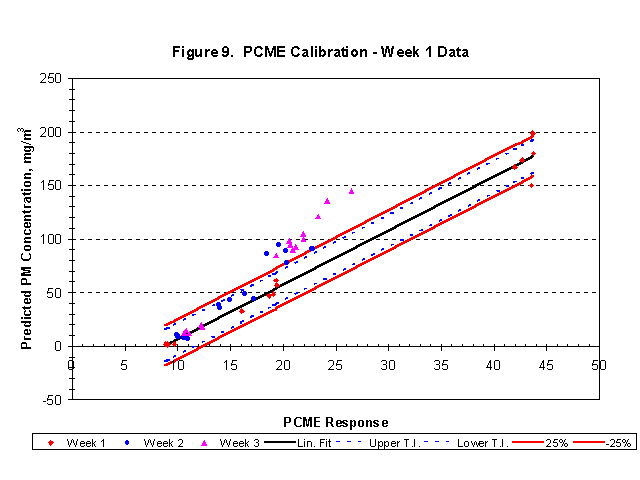
RCA results for the PCME instrument are tabulated
in Table 5 and shown graphically in Figure 9. As one can see from
examination of the results, only five of the 15 values (33%) lie
inside of the ± 25 percent tolerance
interval. Thus, the PCME instrument would not pass EPA’s
proposed RCA criterion.
| Table 5 - PCME Response Calibration Audit – Week 3 Testing | |||||
| Run No. | Predicted
Value (mg/m3) |
Measured
Value (mg/m3) |
Upper T.I.
(mg/m3) |
Lower T.I.
(mg/m3) |
± 25% T.I. |
| 1 | 18.06 | 17.71 | 36.81 | -0.69 | IN |
| 2 | 17.47 | 19.97 | 36.22 | -1.28 | IN |
| 3 | 10.35 | 14.71 | 29.10 | -8.40 | IN |
| 4 | 9.46 | 12.06 | 28.21 | -9.29 | IN |
| 5 | 11.68 | 11.84 | 30.43 | -7.07 | IN |
| 6 | 60.37 | 94.62 | 79.12 | 41.62 | OUT |
| 7 | 59.77 | 98.27 | 78.52 | 41.02 | OUT |
| 8 | 73.80 | 121.16 | 92.55 | 55.05 | OUT |
| 9 | 78.04 | 135.00 | 96.79 | 59.29 | OUT |
| 10 | 89.74 | 144.67 | 108.49 | 70.99 | OUT |
| 11 | 61.55 | 88.91 | 80.30 | 42.80 | OUT |
| 12 | 63.05 | 91.23 | 81.80 | 44.30 | OUT |
| 13 | 53.63 | 87.905 | 72.38 | 34.88 | OUT |
| 14 | 66.64 | 98.075 | 85.39 | 47.89 | OUT |
| 15 | 66.61 | 104.615 | 85.36 | 47.86 | OUT |
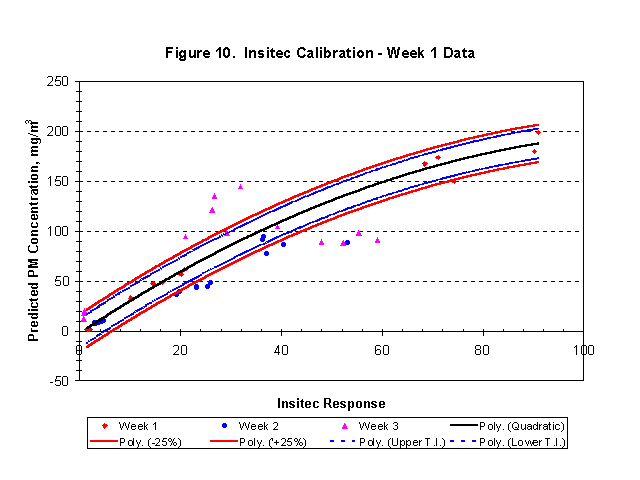
RCA results for the Insitec instrument are
tabulated in Table 6 and shown graphically in Figure 10. As can
be seen from examination of the results, only five of the 14
values (36%) lie inside of the ± 25
percent tolerance interval. Thus, the Insitec instrument would
not pass EPA’s proposed RCA criterion.
| Table 6 - Insitec Response Calibration Audit – Week 3 Testing | |||||
| Run No. | Predicted Value (mg/m3) | Measured
Value (mg/m3) |
Upper T.I.
(mg/m3) |
Lower T.I.
(mg/m3) |
± 25% T.I. |
| 1 | 0.20 | 17.71 | 18.95 | -18.55 | IN |
| 2 | 0.36 | 19.97 | 19.11 | -18.39 | OUT |
| 4 | -0.06 | 12.06 | 18.69 | -18.81 | IN |
| 5 | -0.01 | 11.84 | 18.74 | -18.76 | IN |
| 6 | 61.47 | 94.62 | 80.22 | 42.72 | OUT |
| 7 | 83.31 | 98.27 | 102.06 | 64.56 | IN |
| 8 | 75.72 | 121.16 | 94.47 | 56.97 | OUT |
| 9 | 76.95 | 135.00 | 95.70 | 58.20 | OUT |
| 10 | 90.00 | 144.67 | 108.75 | 71.25 | OUT |
| 11 | 126.05 | 88.91 | 144.80 | 107.30 | OUT |
| 12 | 146.80 | 91.23 | 165.55 | 128.05 | OUT |
| 13 | 134.46 | 87.905 | 153.21 | 115.71 | OUT |
| 14 | 140.20 | 98.075 | 158.95 | 121.45 | OUT |
| 15 | 107.43 | 104.615 | 126.18 | 88.68 | IN |
Of course, we do not believe that RCA results for the Sabata instrument and the opacity monitor are particularly relevant because both analyzers failed one or more of EPA’s proposed PS 11 statistical criteria, during the initial calibrations.
Discussion of Week 3 Results
It is clear from the results presented in Tables 4-6 as well as in Figures 8-10 that the calibration curves for the three instruments (each of which originally met all of the PS 11 statistical criteria) have "shifted" and/or somehow changed. To verify these apparent shifts in calibration curves for the BHA, PCME, and Insitec instruments, a new calibration curve was determined for each instrument, using only the Week 3 data. These curves were compared statistically to the calibration curves determined from the Week 1 data. All the calibration curves were found to be statistically different from those curves derived from the Week 1 data.
Among the key questions to be researched and resolved: (1) what caused the calibration curves to shift; (2) how would an owner/operator know that the calibration curve has shifted; and (3) how can one live with this calibration problem?
CONCLUSIONS